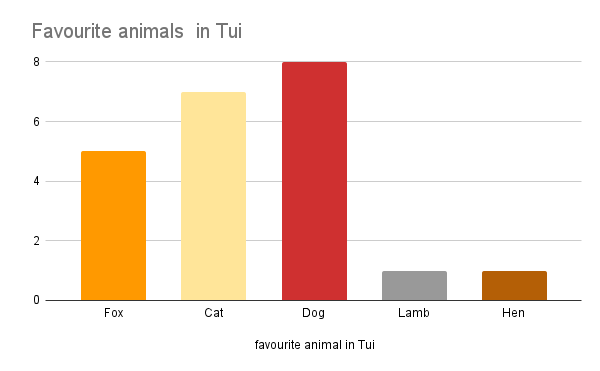
We have been working on Statistics. We have been learning to pose a question for a statistical investigation. We had to collect data by using tally marks. Then we had to make a graph about the data. We drew a graph and this is the one that I made on the computer. I have enjoyed doing statistics because we have to talk to people and collect information. Do you enjoy doing statistics for maths?