We have been learning to use repeated addition to work out multiplication questions.
We have been learning to make arrays. We have been learning to make our own multiplication questions and solve them by ourselves.
We have been learning to use repeated addition to work out multiplication questions.
We have been learning to make arrays. We have been learning to make our own multiplication questions and solve them by ourselves.
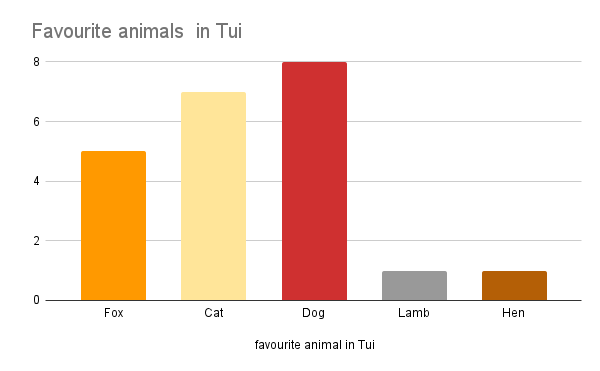
We have been working on Statistics. We have been learning to pose a question for a statistical investigation. We had to collect data by using tally marks. Then we had to make a graph about the data. We drew a graph and this is the one that I made on the computer. I have enjoyed doing statistics because we have to talk to people and collect information. Do you enjoy doing statistics for maths?
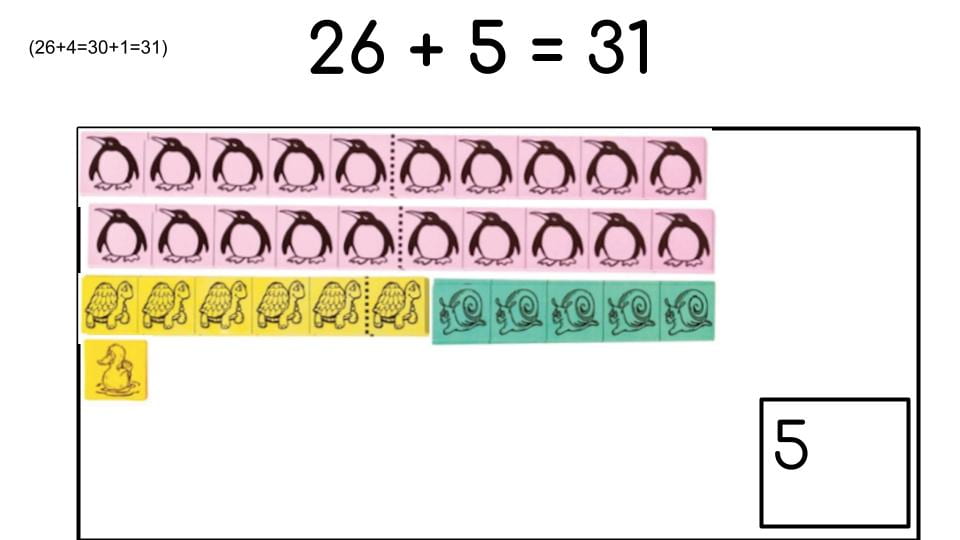
I had to do maths it is called up and over the tens. First I started adding the numbers up in my head so that I could figure out the animal lines to go onto the slide. Then we had to copy them and get it on the right slide and we worked out the answer.
Welcome to your brand new blog at Edublogs!
To get started, simply visit your blog’s dashboard, edit or delete this post and check out all the other options available to you.
We can walk you through step-by-step in our guide to getting started with your blog.
Happy blogging!